
In the Stock Market Today, Sensex rises more than 308 points, Nifty exceeds 23,550; Power Grid, Wipro, ICICI Bank, & Titan lead the gainers
Stock Market Nifty Chart Prediction.

On June 18, Sensex increased by 308 points or xx percent, reaching 77,301, while the Nifty climbed by 92.30 points to 23,557. Throughout the day, 1,928 shares rose, -1,603 shares fell, and 109 shares remained unchanged. Both indices hit new record highs, with the Sensex peaking at 77,366 and the Nifty at 23,579.
Top Nifty gainers: Shriram Finance, Power Grid Corporation, and Wipro
Top Nifty Losers: Maruti Suzuki, Dr Reddys, and Tata Steel
All sectors, excluding IT which fell by 0.7 percent, closed higher. Industries such as auto, telecom, capital goods, healthcare, metal, oil & gas, power, and realty saw gains ranging from 0.5 to 1 percent.
BSE Midcap and smallcap gained 1% each.
Stock Prediction for 19th June 2024.
| STOCK | Good Above | Weak Below |
| LTIM | 5112 | 5075 |
| RELIANCE | 2970 | 2943 |
| SBIN | 850 | 841 |
| TATAPOWER | 452 | 446 |
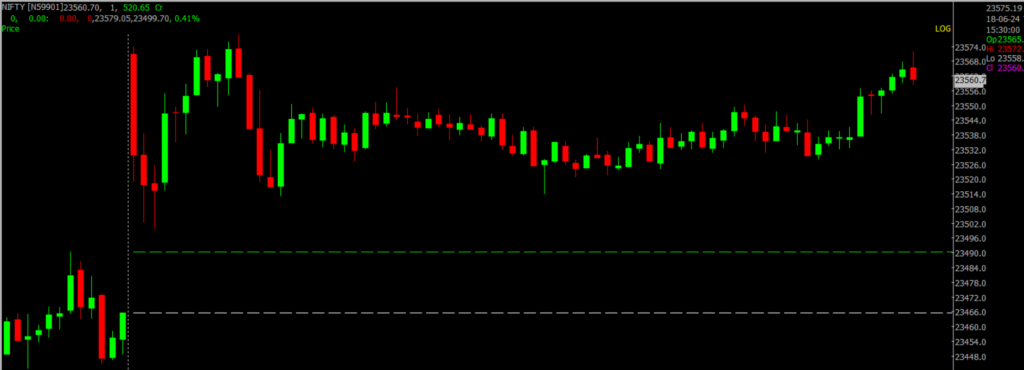
Prediction For Wednesday, NIFTY can go up if it goes above 23,300 or down after the level of 23,800 but it all depends upon the Global cues.
Nifty index continued to trade within a narrow range, showing another day of minimal movement on the daily chart. Recently, Nifty has been trading sideways intraday but has gradually climbed above 23,500. The trend appears positive moving forward, with support levels set between 23,300 and 23,000. A drop below 23,300 could trigger selling pressure. On the upper end, the index could potentially rise to the 23,800-24,000 range.
| Highest Call Writing at | 23,800 (42.1 Lakhs) |
| Highest Put Writing at | 23,300 (59.1 Lakhs) |
Nifty Support and Resistance
| Support | 23,300 – 23,000 |
| Resistance | 23,800 – 24,000 |
Bank Nifty Daily Chart Prediction.
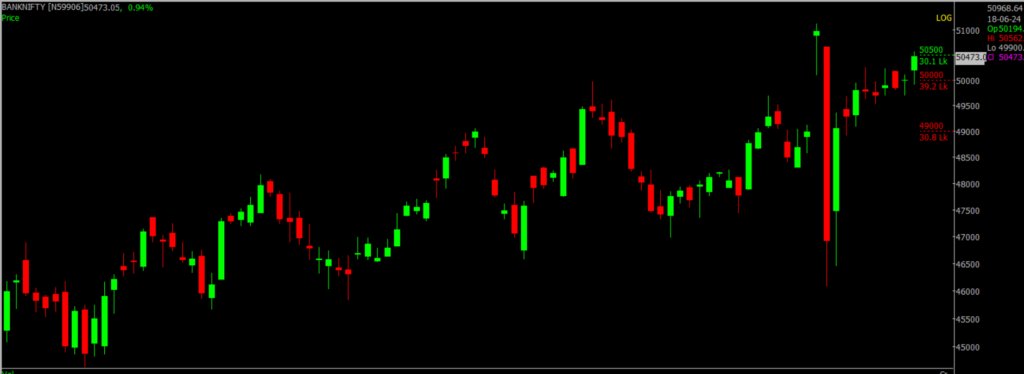
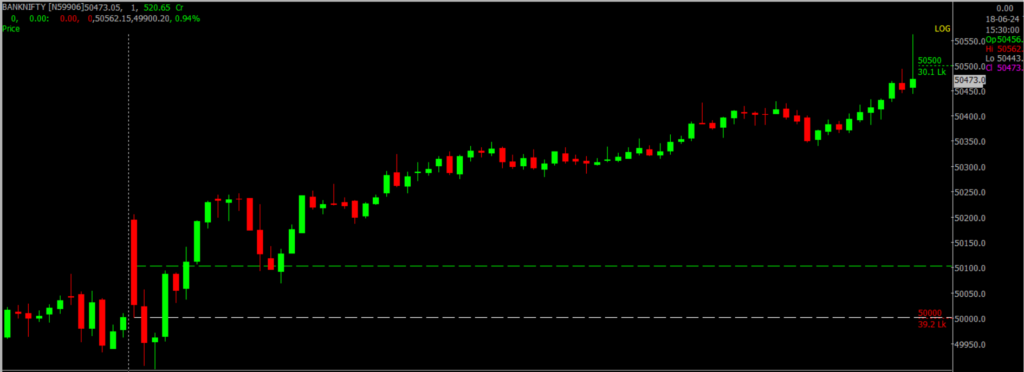
Prediction For Wednesday, Bank NIFTY can go up if it goes above 50,500 or down after the level of 50,000 but it all depends upon the Global cues.
Bank Nifty is showing a positive trend. If you have long positions, it is advisable to maintain them with a daily closing stop-loss set at 49,333. The resistance is between 50,500 and 51,000, while the support is in the 50,000 to 49,500 range.
| Highest Call Writing at | 50,500 (30.1 Lakhs) |
| Highest Put Writing at | 50,000 (39.2 Lakhs) |
Bank Nifty Support and Resistance
| Support | 50,000 – 49,500 |
| Resistance | 50,500 – 51,000 |
Highly Profitable Algo Trading Strategies. Try Spider Now: Register Now
If you’d like to know how we analyze the market and provide accurate levels every day. then click on the Free Demo button below and change your trading life for good. 5X returns are possible in options trading If you have Spider Software in your trading system.
Disclaimer: The information provided in this Blog is for educational purposes only and should not be construed as financial advice. Trading in the stock market involves a significant level of risk and can result in both profits and losses. Spider Software & Team does not guarantee any specific outcome or profit from the use of the information provided in this Blog. It is the sole responsibility of the viewer to evaluate their own financial situation and to make their own decisions regarding any investments or trading strategies based on their individual financial goals, risk tolerance, and investment objectives. Spider Software & Team shall not be liable for any loss or damage, including without limitation any indirect, special, incidental or consequential loss or damage, arising from or in connection with the use of this blog or any information contained herein.